Sydney is known for its ambitious infrastructure projects, high rise developments, and urban expansion. However, the city’s construction sector faces a looming challenge—sustainability.
The industry is grappling with its significant carbon footprint, waste generation, and the demand for greener alternatives.
In this article, we’ll explore how sustainable Sydney’s construction sector really is and insights into the city’s efforts to reduce its environmental impact.
Carbon emissions in Sydney’s construction sector
The global construction industry is a significant contributor to greenhouse gas emissions, accounting for 38 per cent of global CO2 emissions.
Types of greenhouse gas emissions in NSW
Carbon emissions remain one of the biggest hurdles for the construction industry, both globally and in Sydney, where energy intensive materials and processes are driving up environmental costs.
In 2019, around 141 megatonnes (Mt) of carbon dioxide equivalent (CO2-e) was emitted in NSW, excluding the land sector. The main sources were:
- stationary energy for electricity generation emitted 52 Mt of CO2-e (37 per cent of total NSW emissions)
- transport emitted 28 Mt CO2-e (20 per cent)
- agriculture emitted 16 Mt CO2-e(12 per cent)
- stationary energy (other) emitted 15 Mt CO2-e (11 per cent)
- fugitives from fuels emitted 13 Mt CO2-e (9 per cent)
- industrial processes and product use emitted 13 Mt CO2-e (9 per cent)
- waste emitted 5 Mt (3 per cent).
Land use, changes in land use, and forestry in NSW helped cut total emissions by 5 Mt (3 per cent).
As a result of more carbon dioxide being absorbed by plants than was released through activities like land use and land clearing.
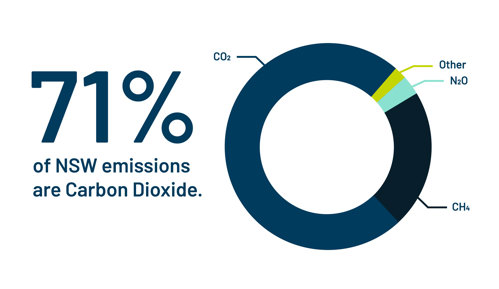
In New South Wales, as with the rest of Australia and globally, the majority of greenhouse gas emissions come from carbon dioxide, with methane and nitrous oxide following closely behind.

Trends in NSW emissions
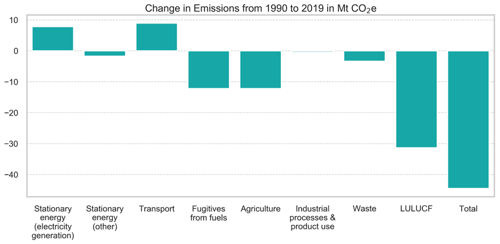
Overall, total NSW emissions were 44 Mt CO2-e (or 25 per cent) lower in 2019 than in 1990.
Emissions in certain sectors rose between 1990 and 2019.
- stationary energy emissions for electricity generation increased from 44 Mt to 52 Mt (18 per cent)
- emissions from transport also increased from 19 Mt to 28 Mt (48 per cent).
All other sources decreased over the same period:
- land use, land use change and forestry emissions decreased from +27 Mt to ?5 Mt (117 per cent)
- fugitives emissions from fuels decreased from 25 Mt to 13 Mt (49 per cent)
- emissions from agriculture decreased from 29 Mt to 16 Mt (43 per cent)
- waste emissions decreased from 8 Mt to 5 Mt (41 per cent)
- stationary energy (others) emissions decreased from 17 Mt to 15 Mt (10 per cent)
- industrial process and product use emissions decreased from 13.2 Mt to 12.8 Mt (3 per cent).
How NSW compares with the rest of Australia and the world
NSW performs better than much of Australia on an emissions per person basis. NSW emissions were about 18 tonnes CO2-e per person in 2018. This is below the national average of 22 tonnes per person.
NSW greenhouse gas emissions represent about one quarter of Australia’s total emissions (25 per cent), while NSW is home to around one-third of Australia’s population.
However, both NSW and Australia continue to fall behind other countries globally. Per-person emissions in NSW and Australia are much higher than the average for other high income countries (10 tonnes CO2-e per person, as recorded in 2016 by the World Bank).
The NSW Waste and Sustainable Materials Strategy 2041 highlights that:
- Emissions from organic waste breaking down in landfill make up more than 2 per cent of total net annual emissions in NSW
- Nearly half of global emissions are attributable to the use and management of materials and products.
How much waste does the NSW construction sector generate?
Beyond emissions, the construction sector’s waste footprint is also significant, but recycling efforts show promise in reducing this environmental burden.
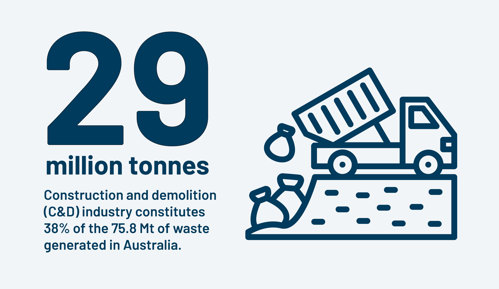
As of today, the construction and demolition (C&D) industry constitutes 38 per cent of the 75.8 Mt of waste generated in Australia, amassing 29 Mt.
With the surging rates of urban development across Australia, especially in large states like NSW and Victoria, construction and demolition waste increased by 25 per cent, which means:
- Each year, approximately 25.2 million tonnes of construction and demolition waste are produced, equating to around 980 kilograms per person.
- 3724 kiloton of building and demolition materials from the C&D waste stream are discarded in landfills.
This article was first published on The Fifth Estate. Read the original here.


